Project Summary
A representation of a company using the Design Fiction archetype of an Annual Report as seen from its anticipated, speculated future based in the analytics and rational representations of the company's Financial Model.
Client:
Team: Near Future Laboratory, OMATA
Project Year: 2020
Project Dates:Published On: Jan 22, 2024, 22:43
Updated On: Apr 14, 2024, 21:53
Written By: Julian Bleecker
omata-annual-report-from-the-futureProject Semantic Tags ANNUAL REPORTARCHETYPEDESIGN FICTIONMAGAZINEPITCH DECK
The Project
Create a representation of a company using the Design Fiction archetype of an Annual Report as seen from its anticipated, speculated future based in the analytics and rational representations of the company's Financial Model.
The Outcomes
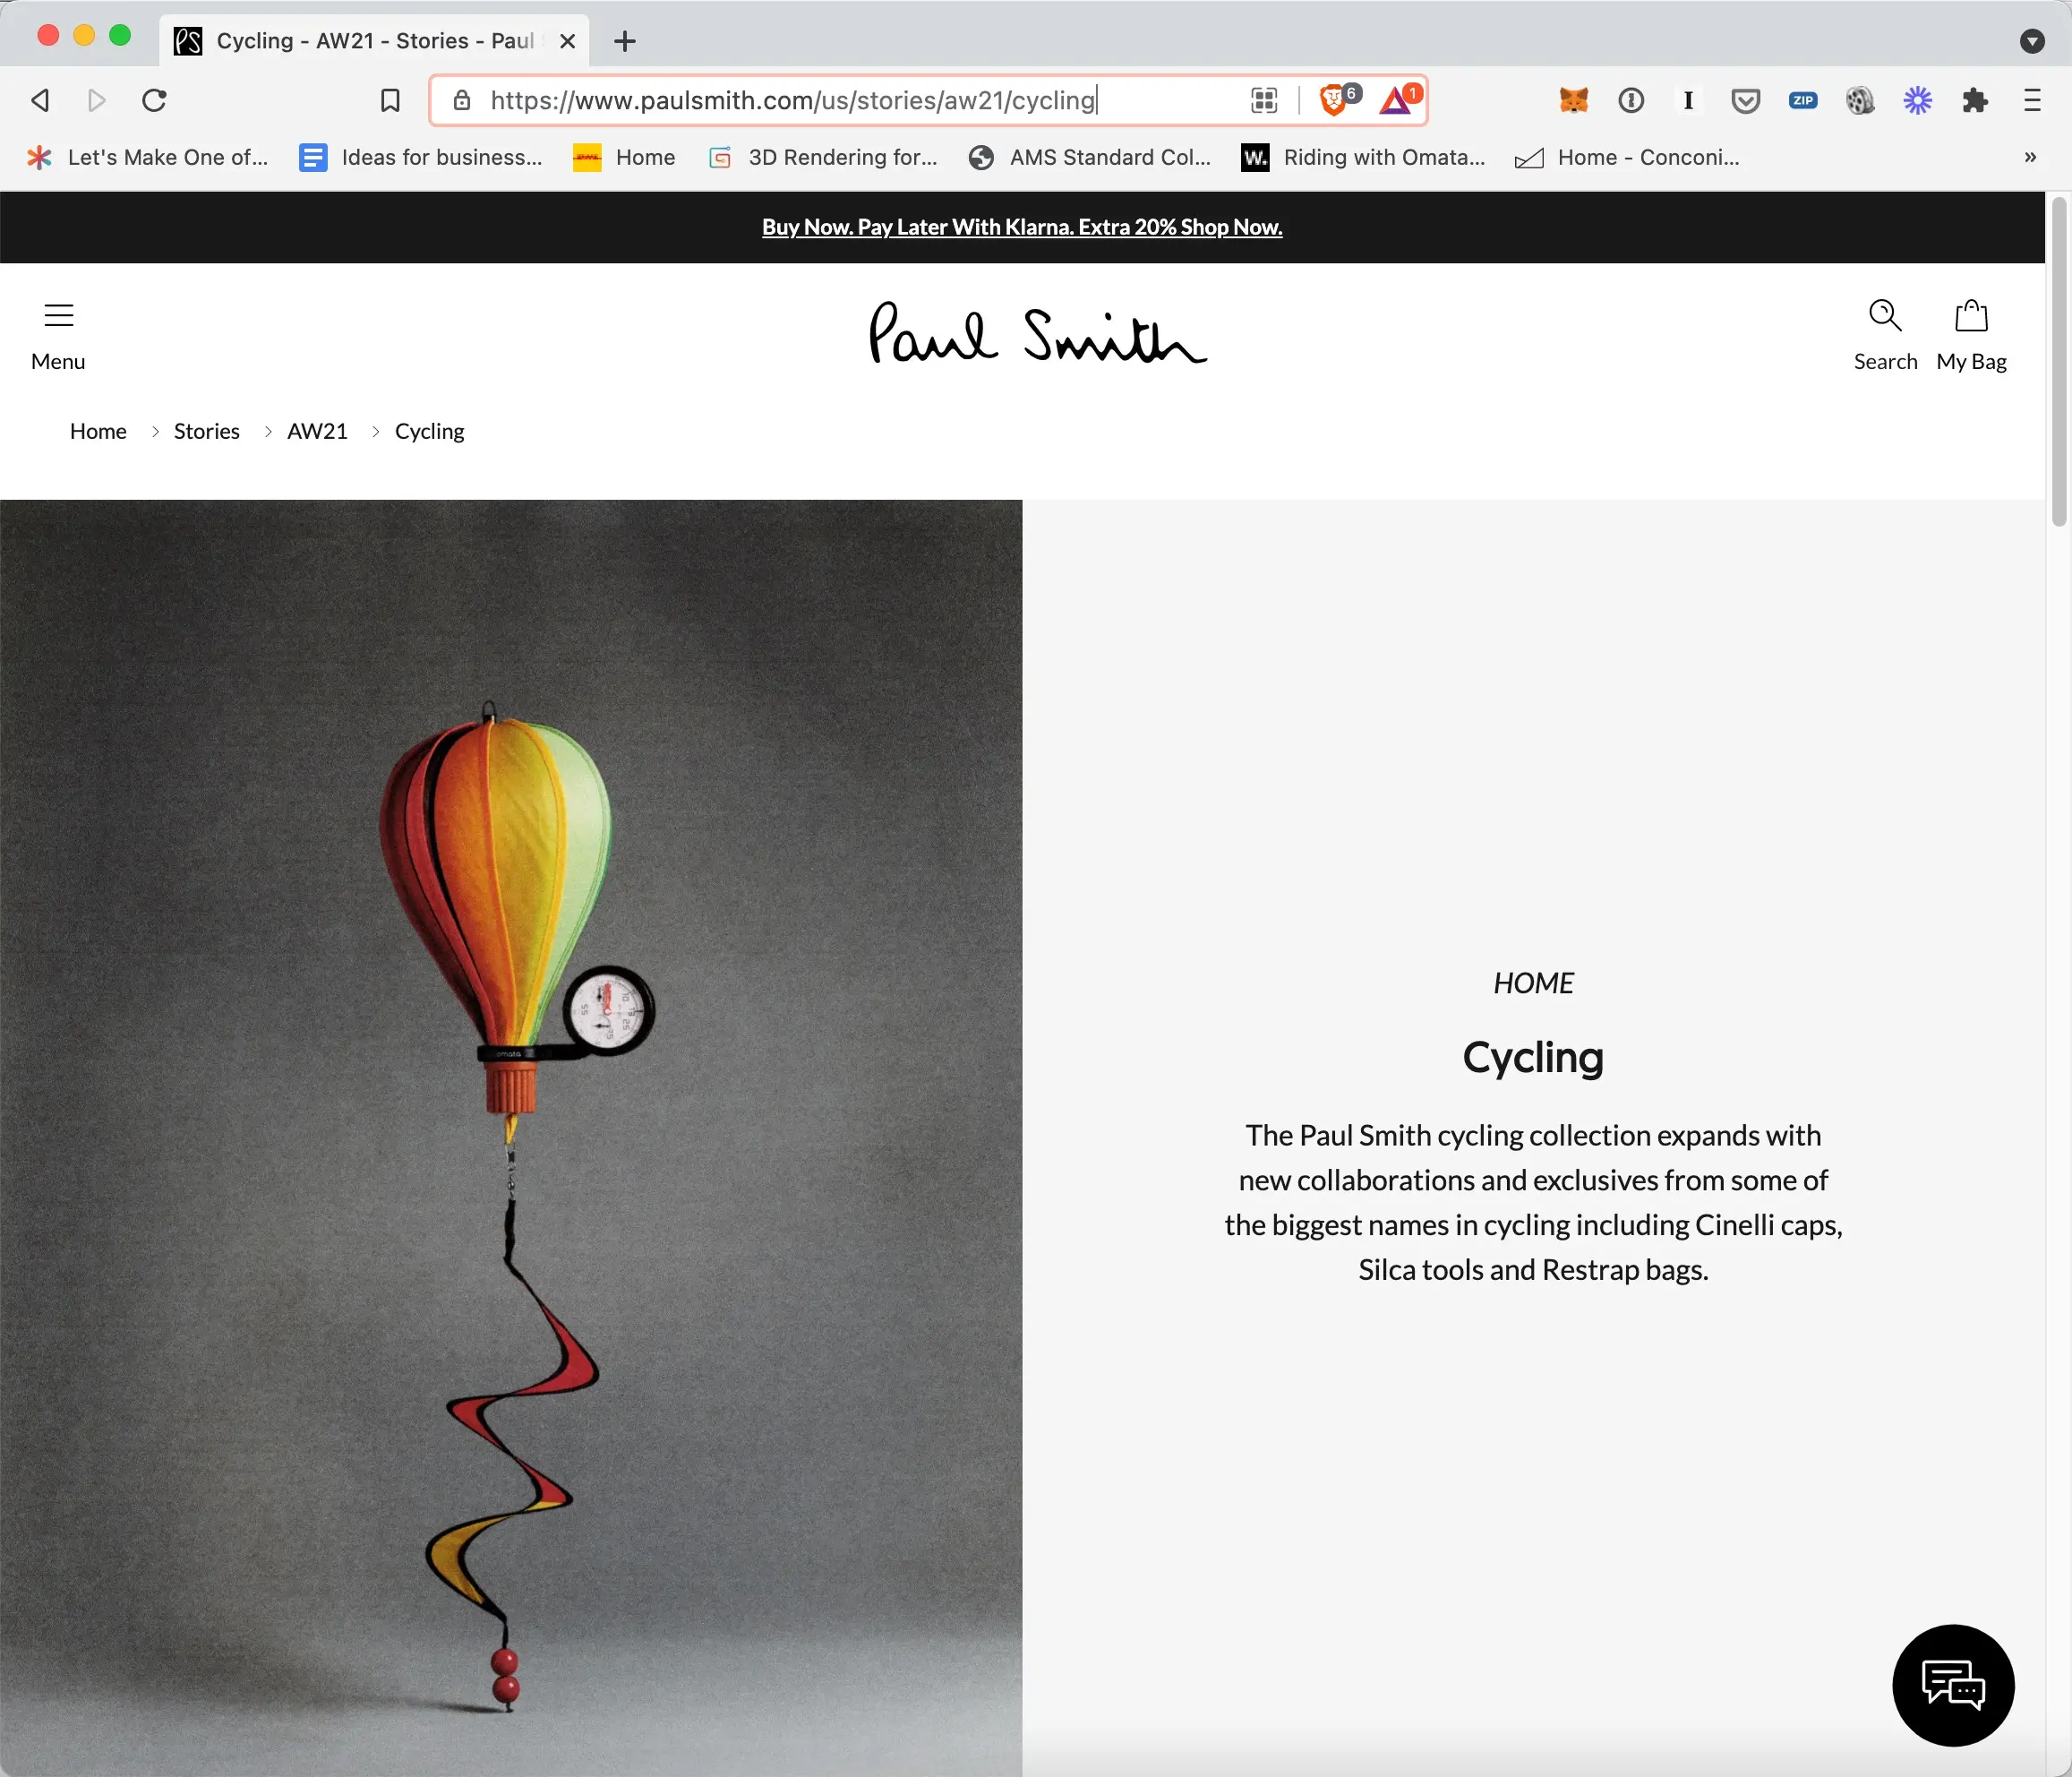
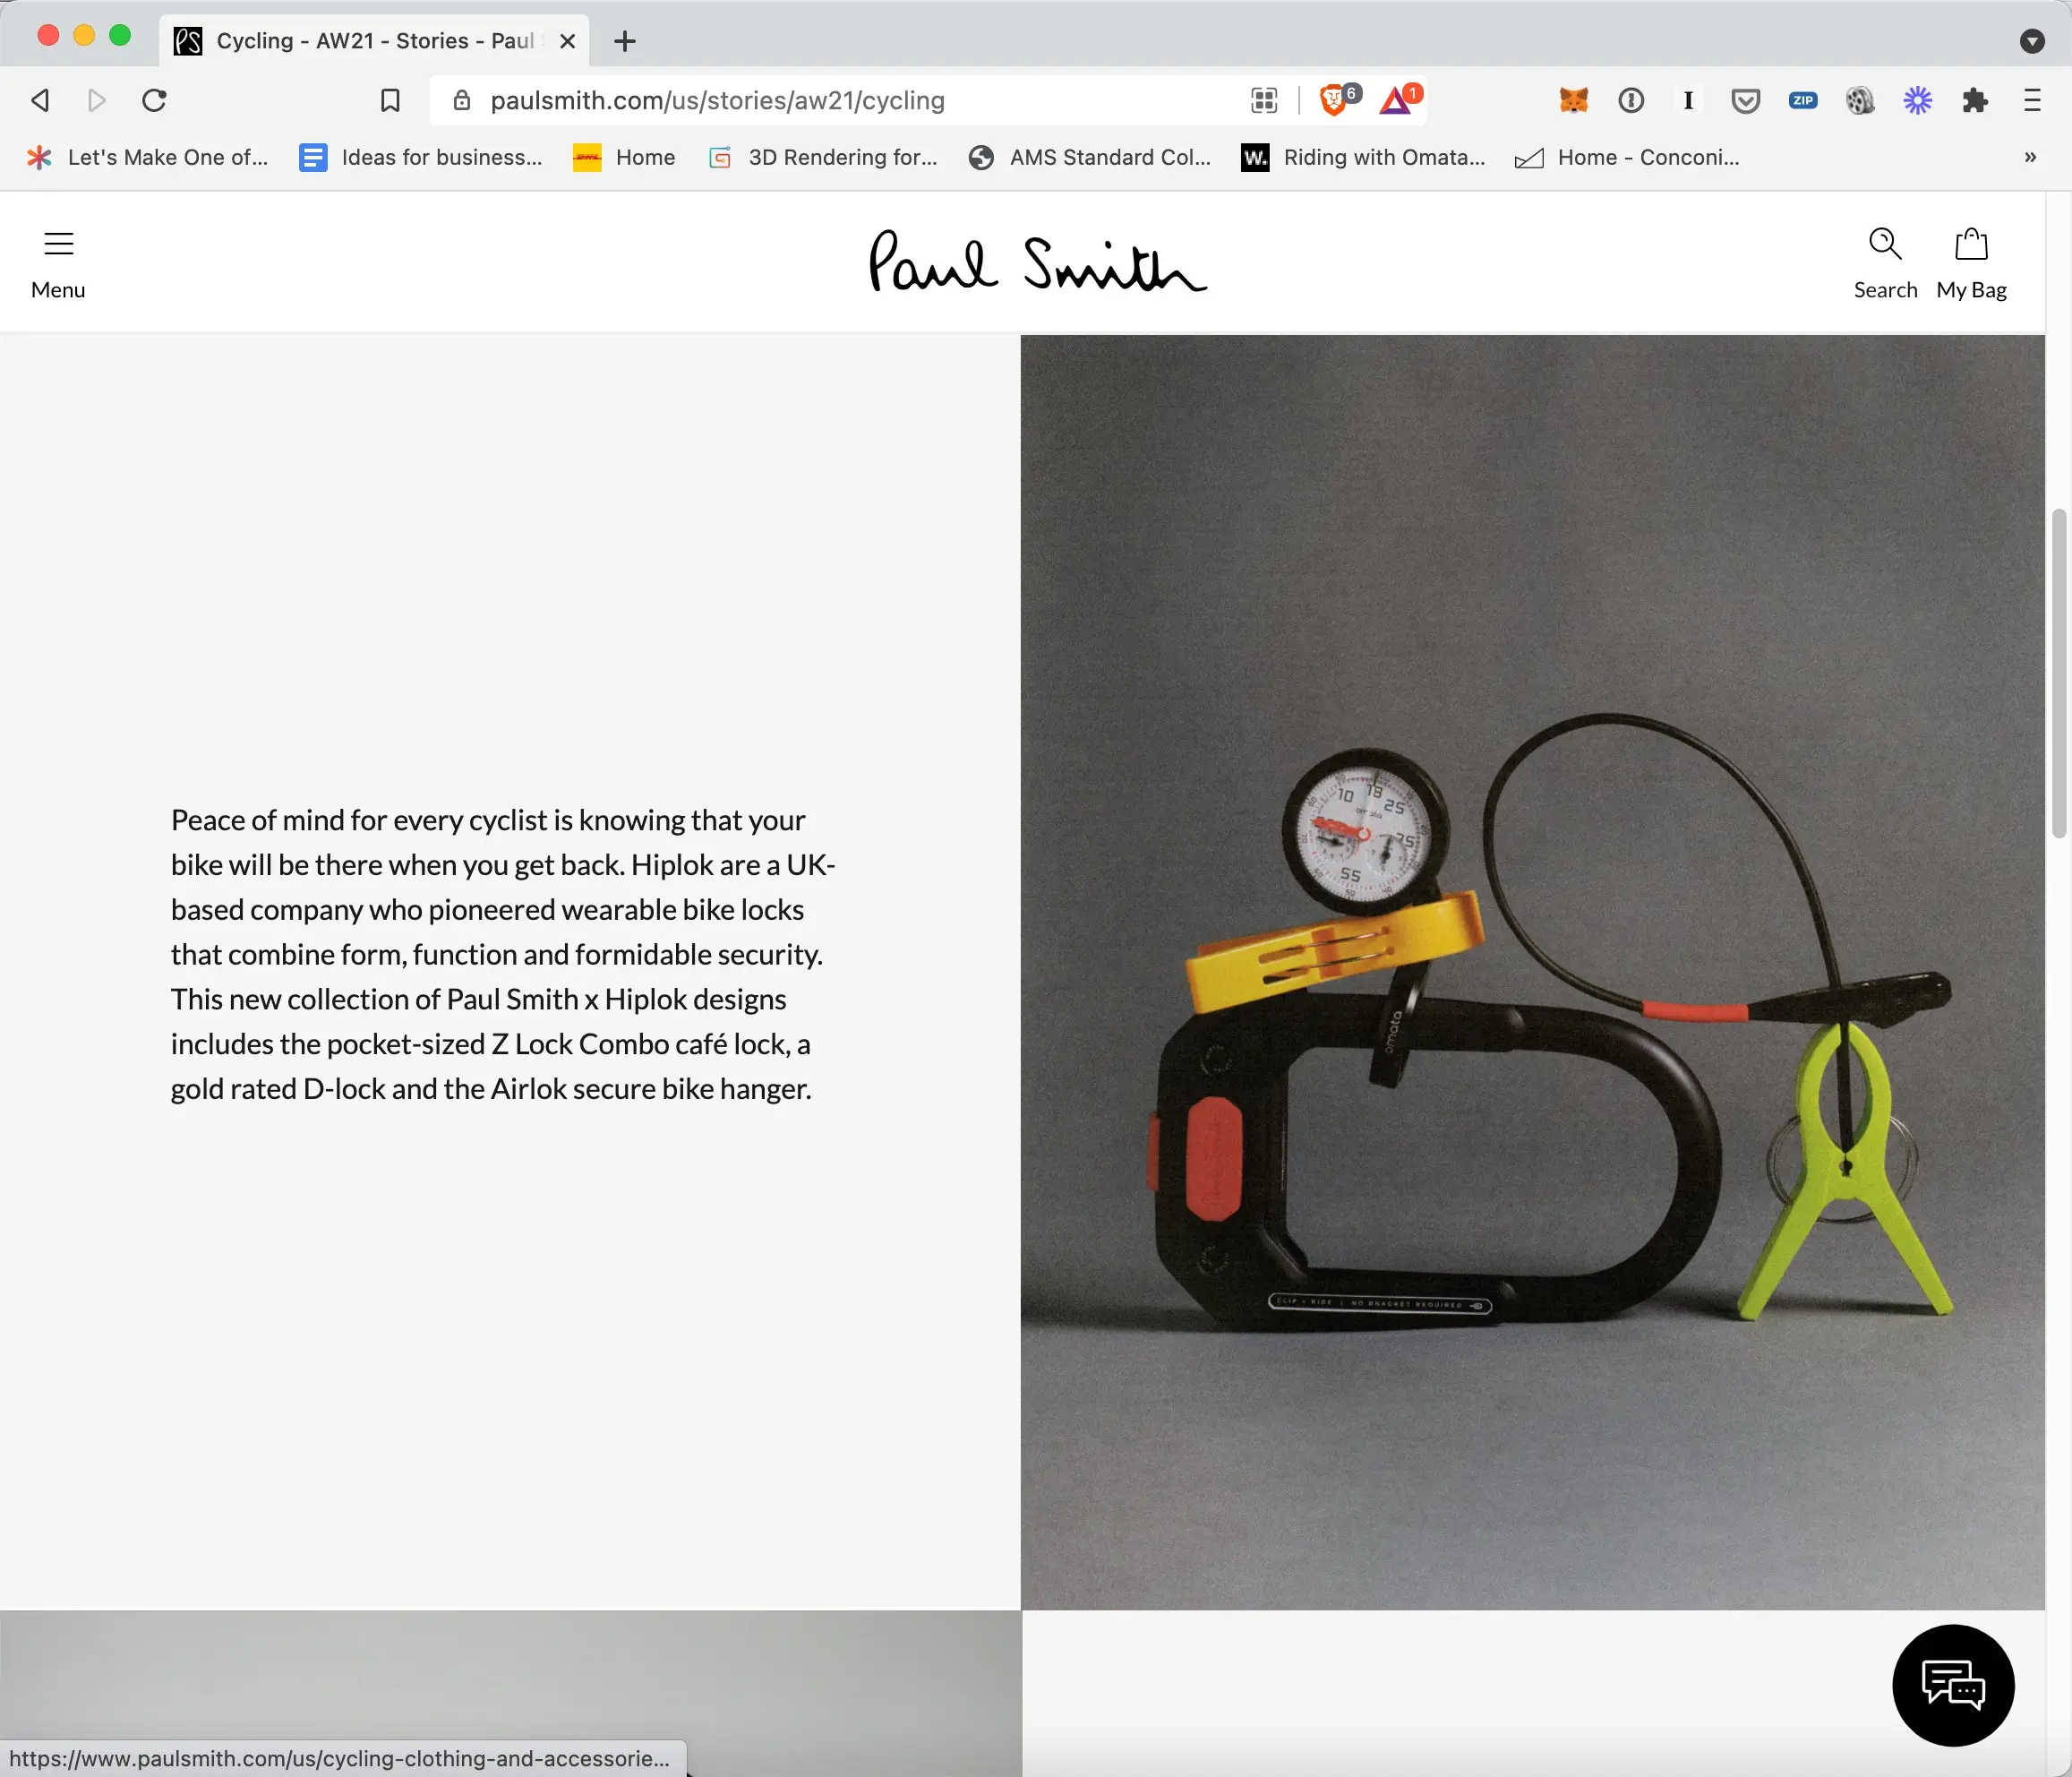
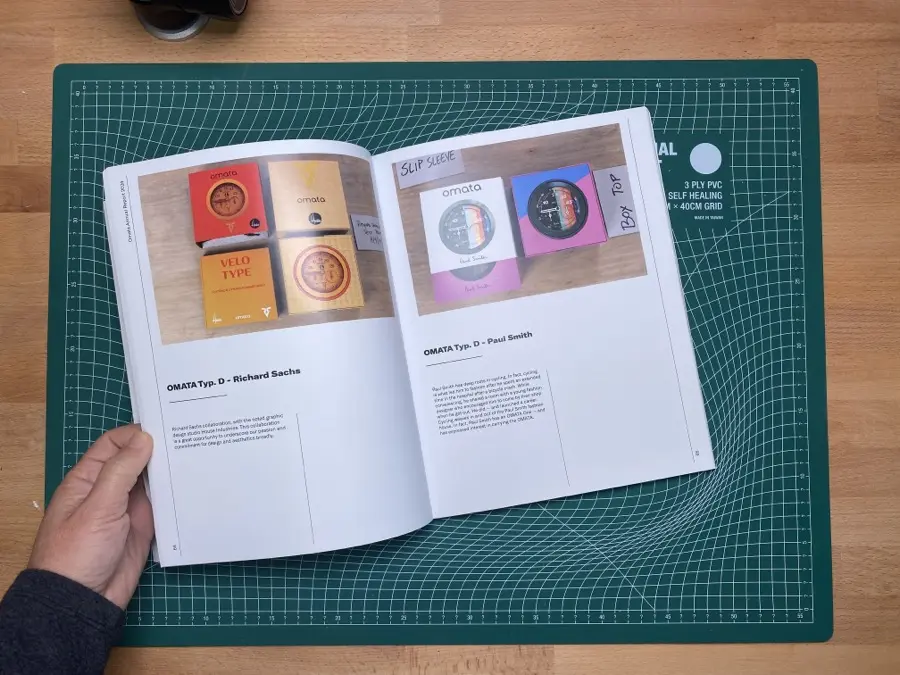
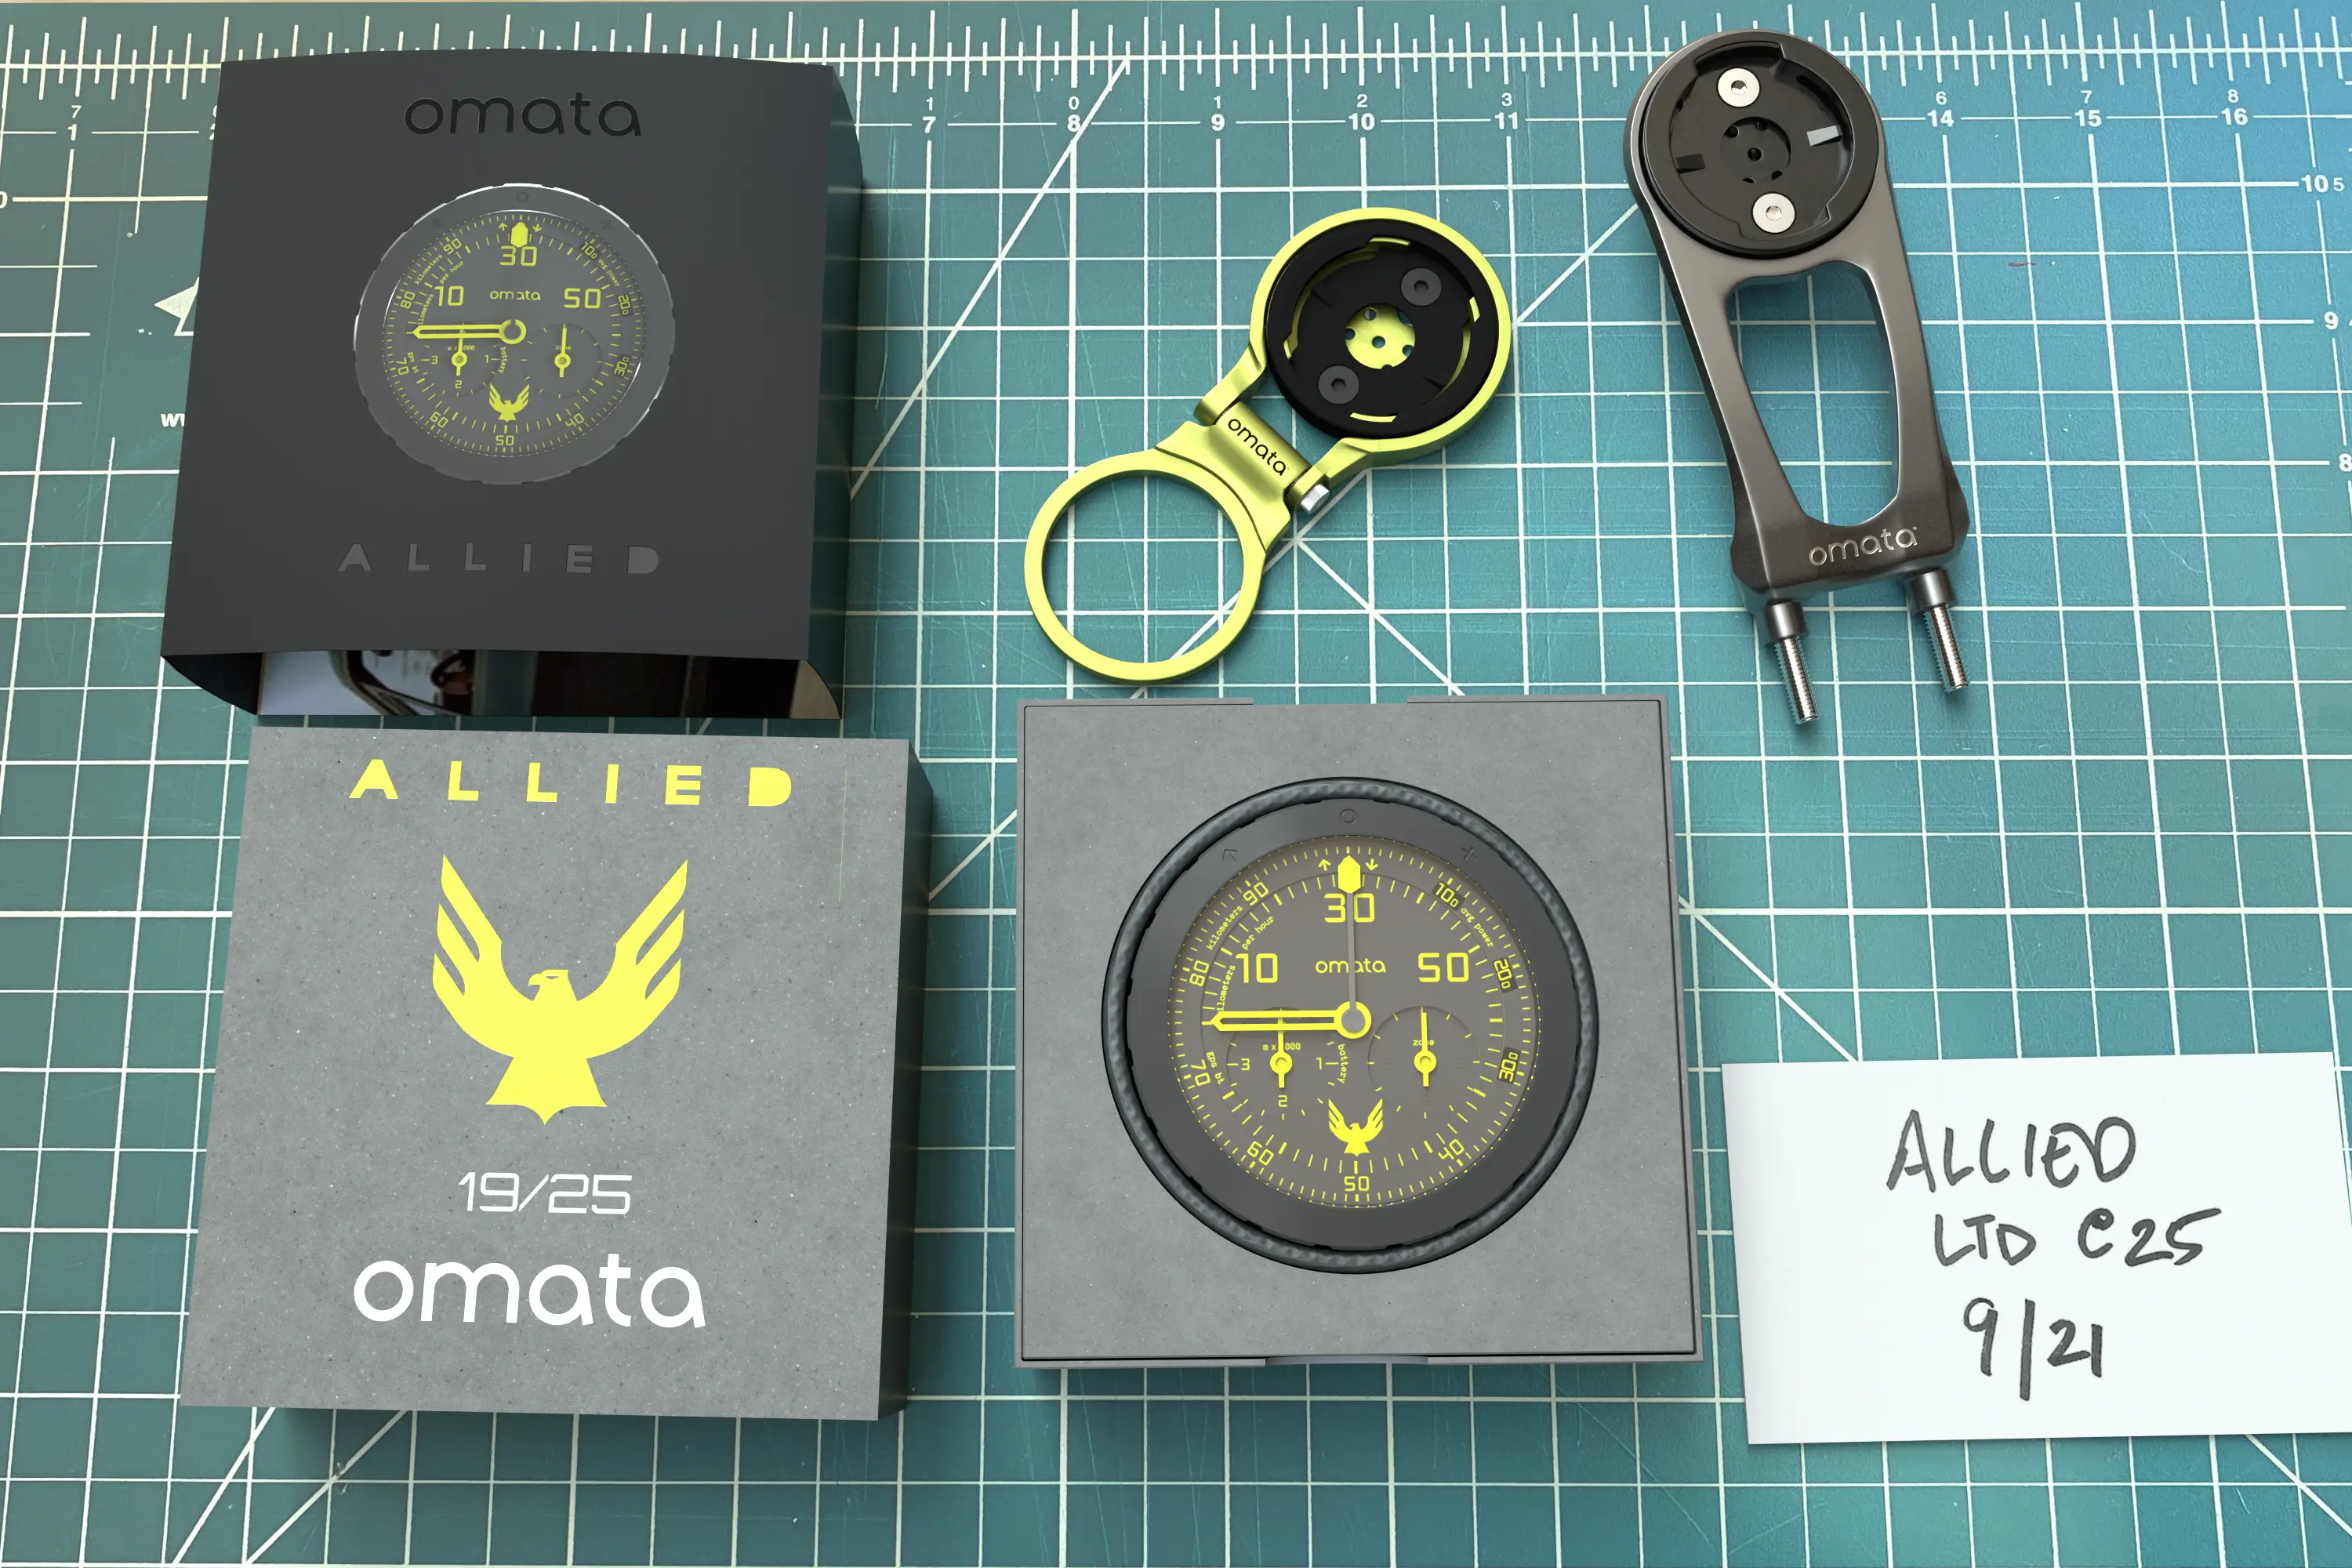
The OMATA 2024 Annual Report proved to be a highly effective representation that translated, communicated, and described the vision I had for the company much more effectively than, and with a higher degree of resolution and meaning than could be accomplished with the terse and constrained form of a PowerPoint presentation. The successful outcomes were the development of a high-visibility retail collaboration with the fashion designer Sir Paul Smith, increased social media traction through posts of future product concepts, and most importantly a successful sale of the company allowing the brand and product to continue.
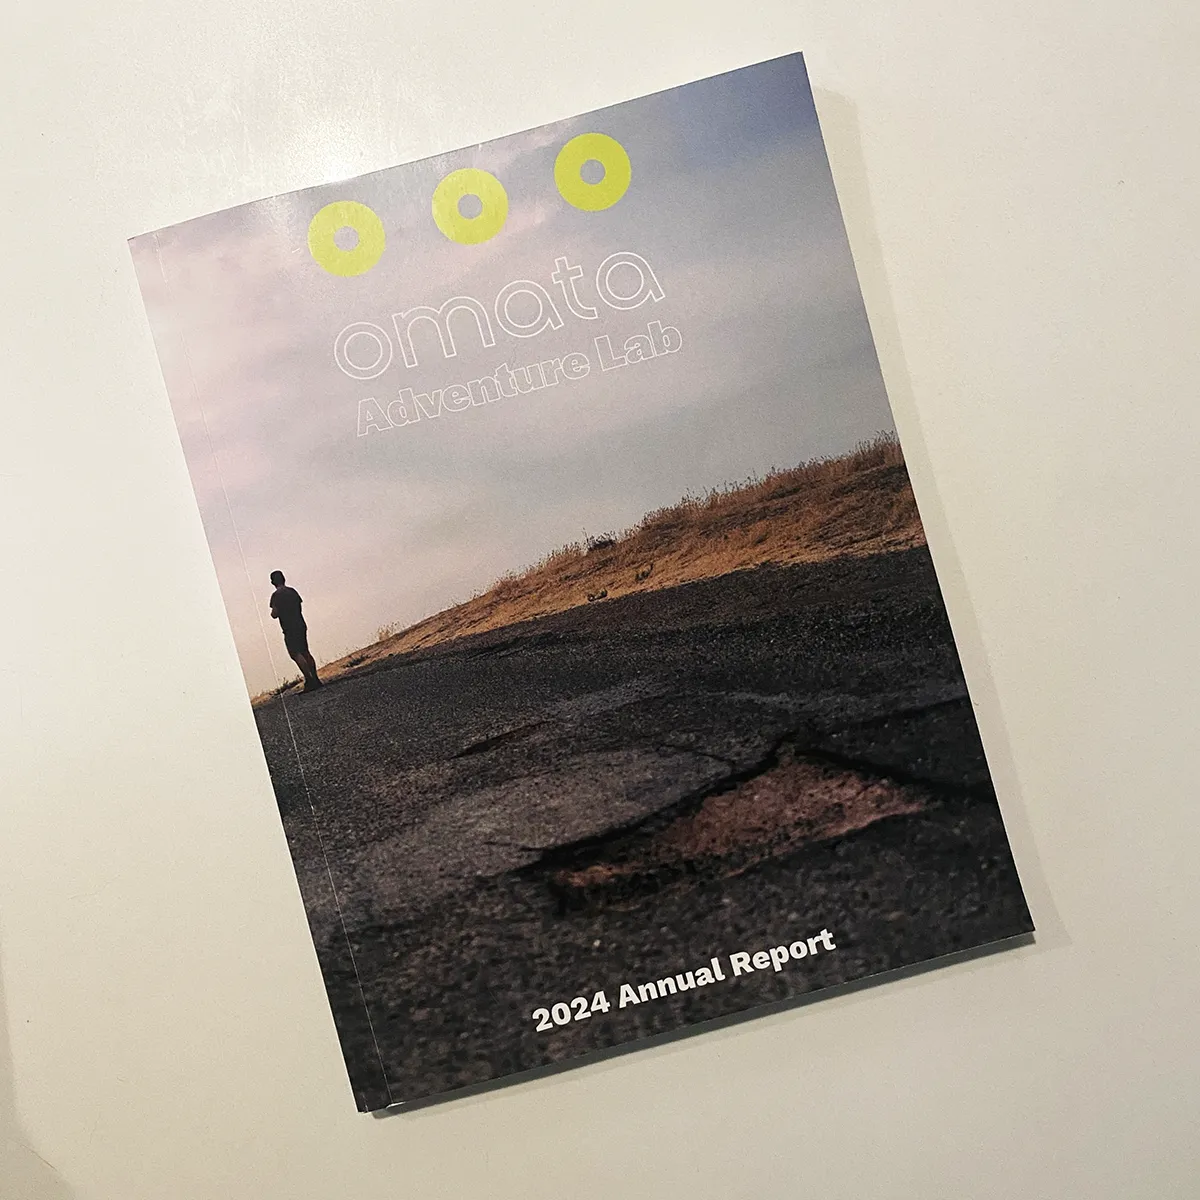
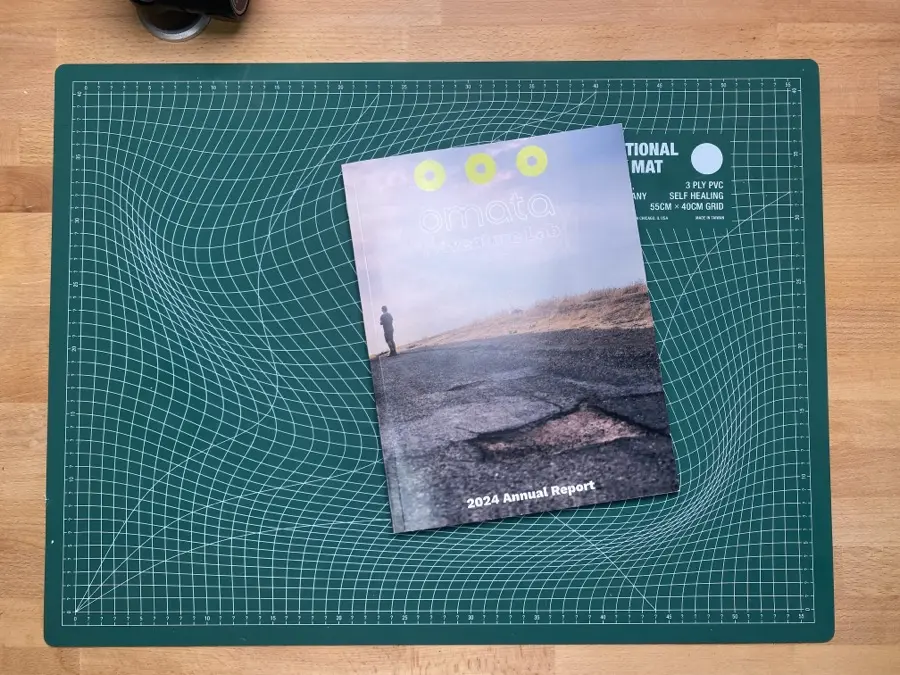
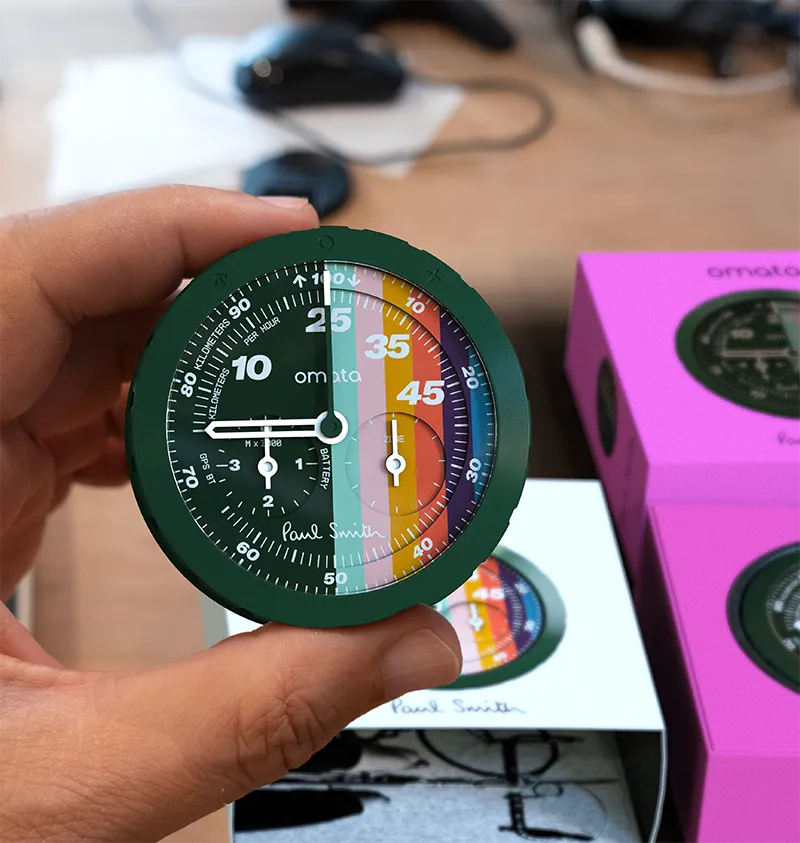
OMATA 2024 Annual Report (from the future of 2020/21)
***
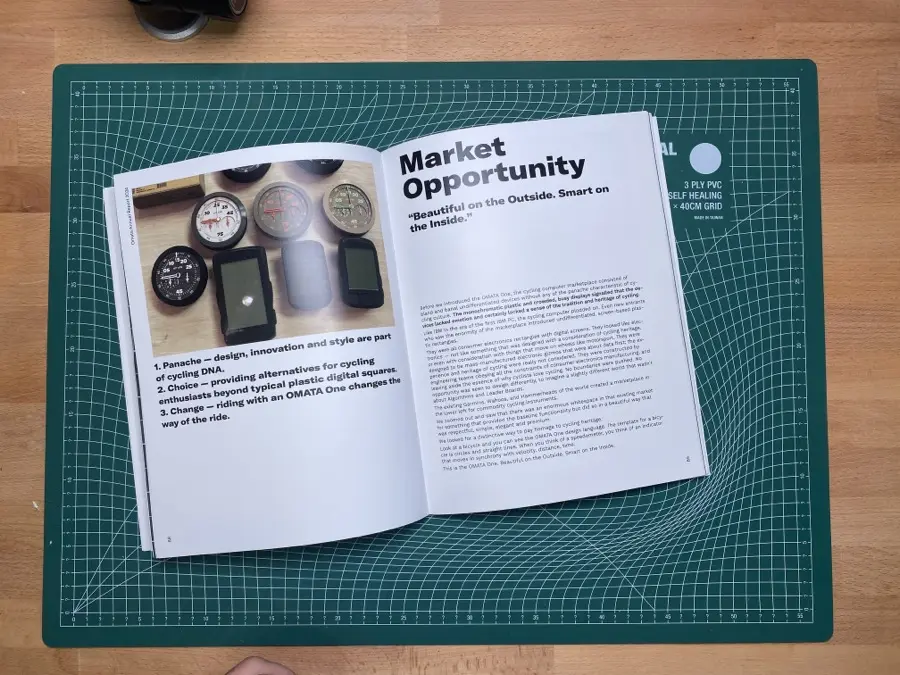
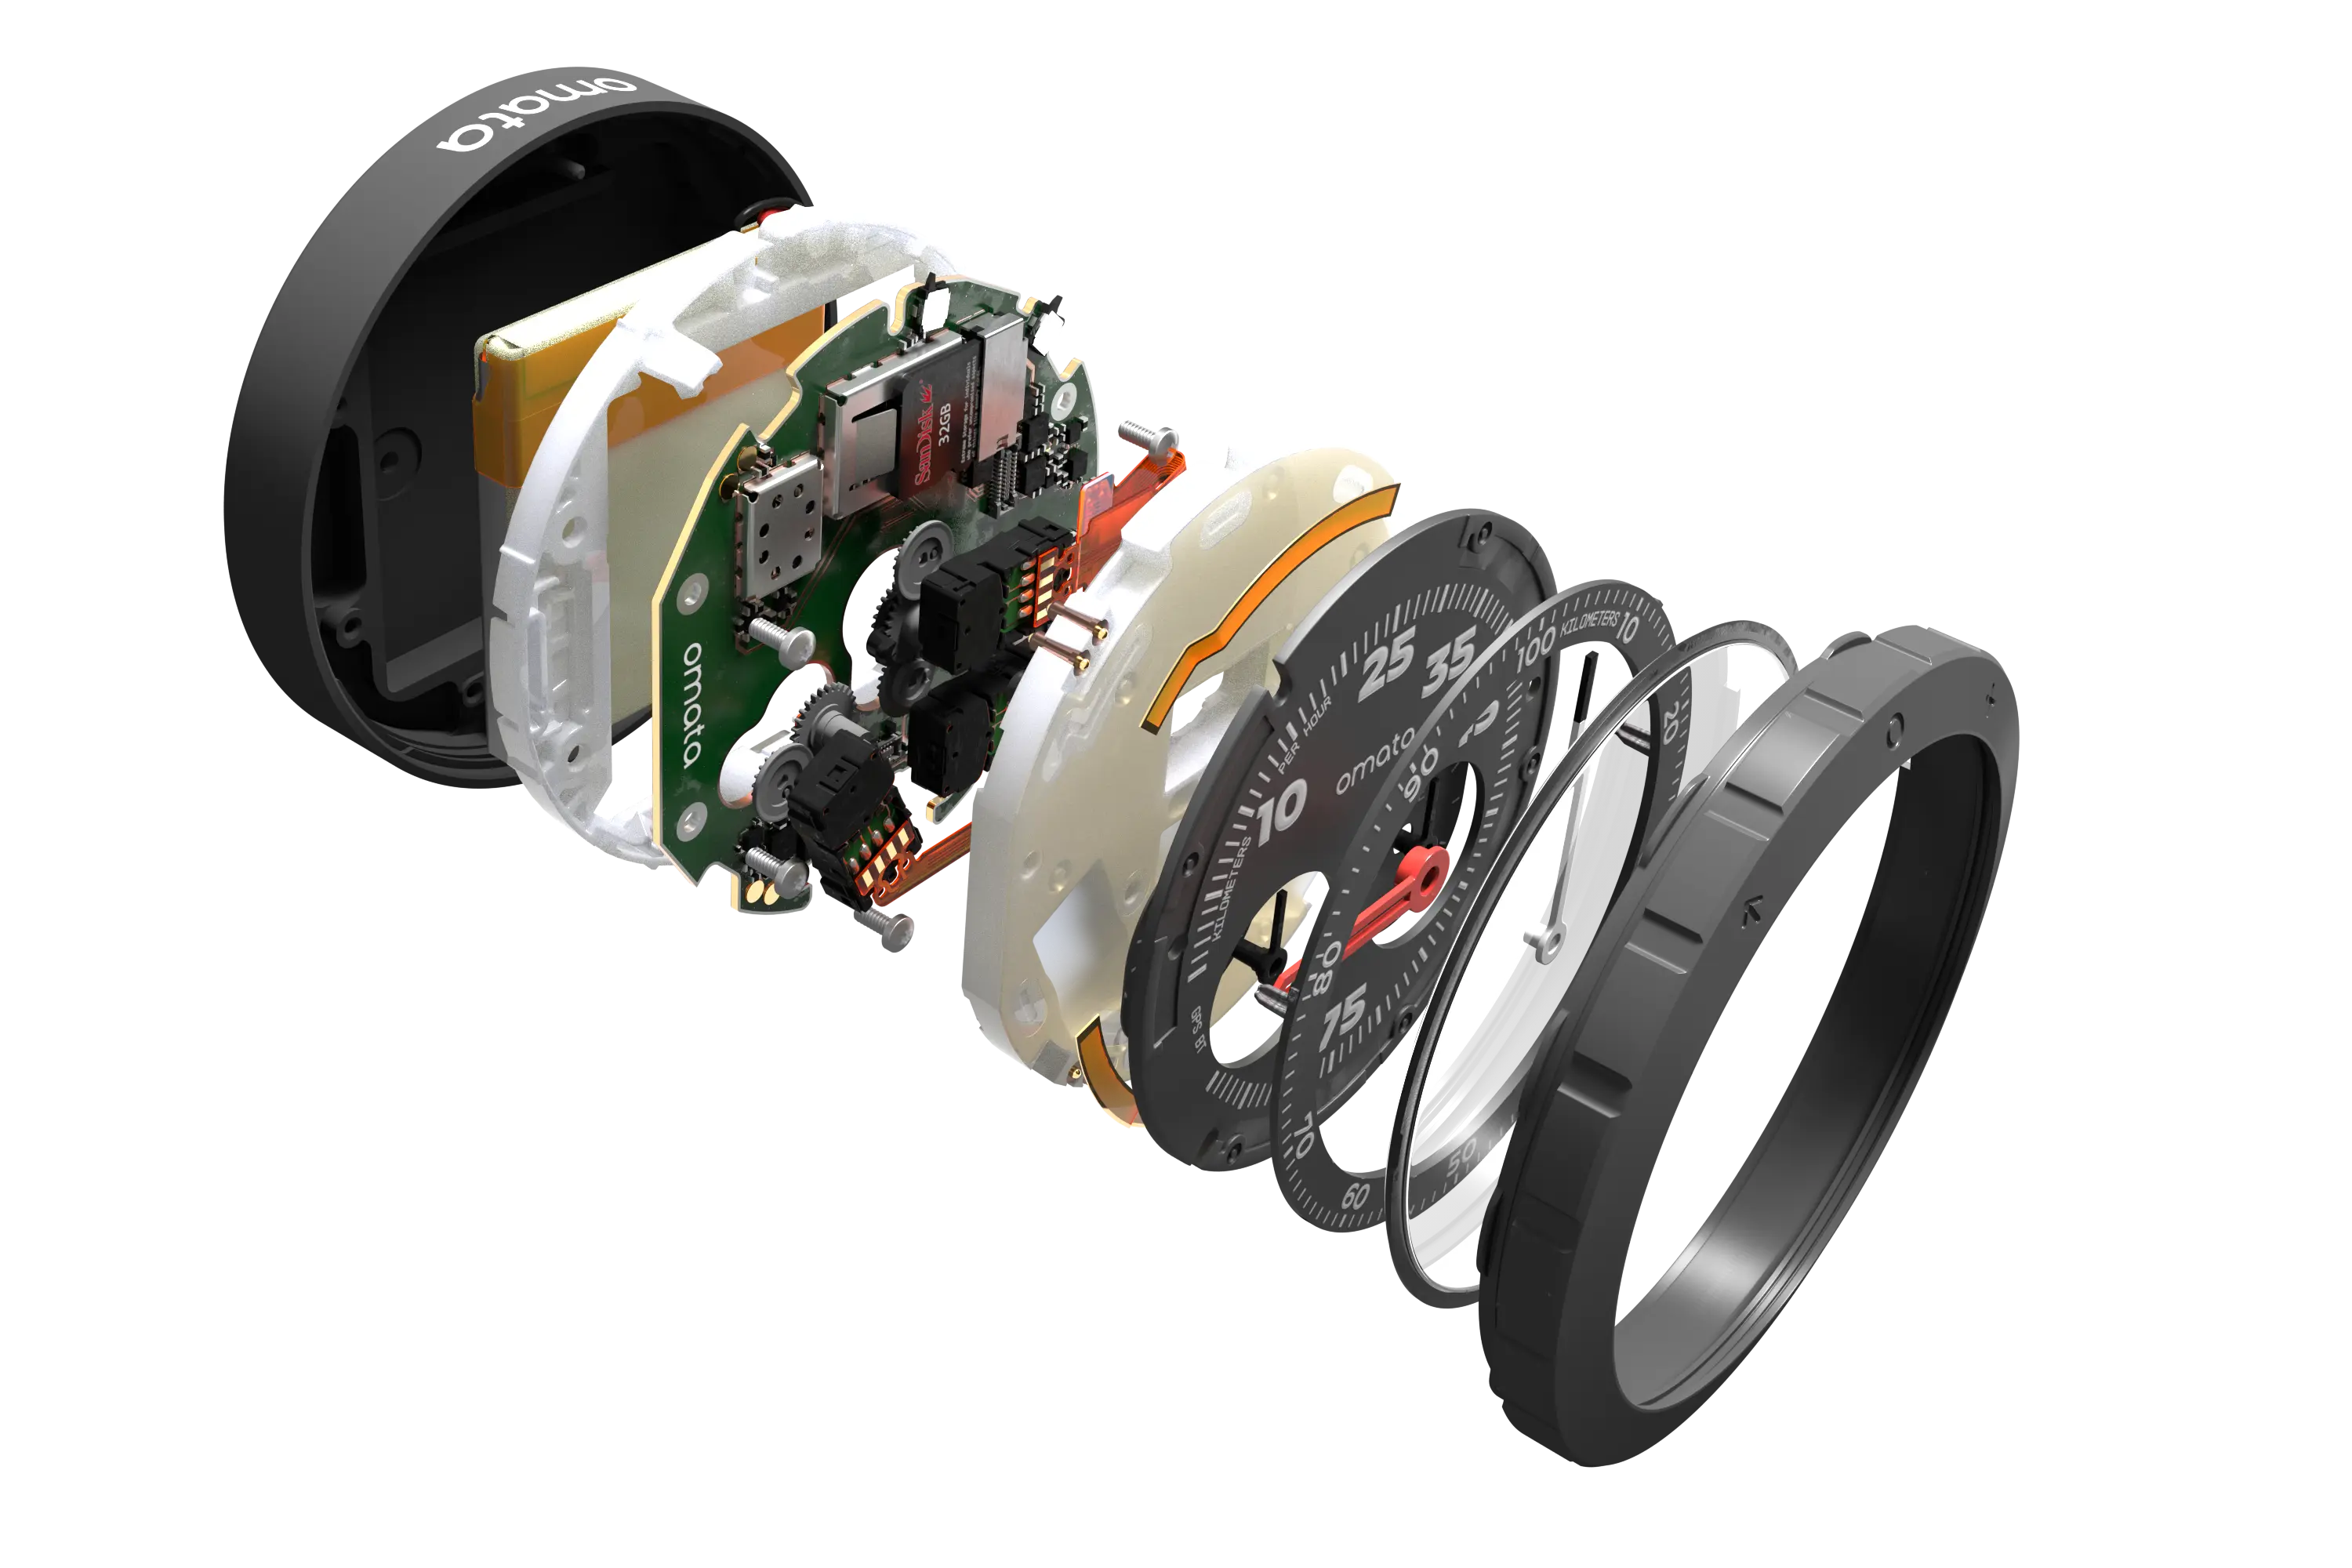
At the end of 2014, I founded the product design company OMATA. My ambition was to create the OMATA One, a cycling computer that challenged assumptions about what a cycling computer could be. Investment capital was raised and the product was successfully entered into a marketplace in which there were two other cycling computers, both effectively undifferentiated by virtue of being rectangular plastic digital gee-gaws that reflected more about data than they did about the values, spirit, and character of a beautifully simple machine and exquisite and adored sport with a rich history and refined sensibilities.
During the Covid Pandemic, around 2021, I struggled to raise capital to fund a subsequent production run and ramp up the company. I became frustrated with the traditional constraints of the expected ‘11 page PowerPoint pitch deck’ and decided to use Design Fiction to represent the future I envisioned. Using the financial model I had built, I project forward four years and wrote the Annual Report for the company from 2024. This became the best representation of what the company could become — way better than a traditional PowerPoint pitch deck.
At 96 pages, it was a visceral deep-dive into the organization, team, product development, marketing efforts, all represented as if.


I’ve been struggling these months trying to write another of the required Pitch Decks you have to put together when you’re in a funding round. My eyes were glazing over looking at lots of my old pitch decks trying to figure out how best to represent the Vision I had.
Translating a Vision into bullet points resulted in ‘slides’ that lacked the kind of acuity I thought the Vision deserved. Representing my imagination through clip art, and Excel graphs was like trying to enjoy a meal of broken glass. Seeing some vivid idea that had been swirling around in my head become mutilated by PowerPoint’s constraints was beyond frustrating.
I’m pragmatic though. I know that I needed something concrete.
So, I wrote an Annual Report…from 2024.
That’s right — I wrote an Annual Report from four years in the future back to myself today. It’s an Annual Report from the Future. Maybe the first one ever.
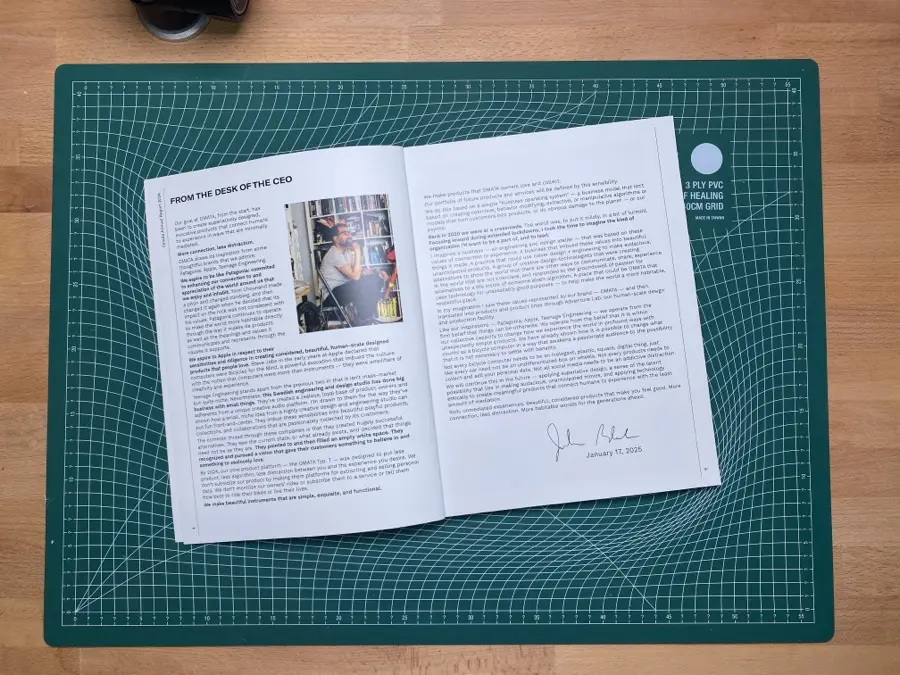
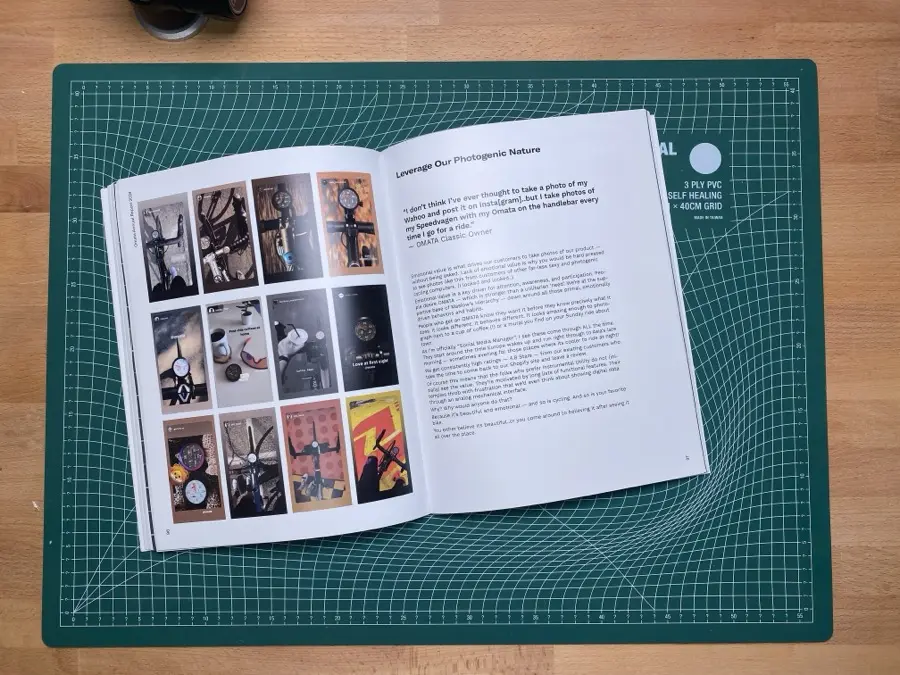
It’s got what you’d expect in an Annual Report, everything from the ‘From the Desk of the CEO’ outlining the Vision and the accomplishments to the future product portfolio and those end pages in Annual Reports with lots of financials, the P&Ls and those pesky Balance Sheets. There’s (real) customer feedback, a social media strategy, even the things I imagine and hope will be said about the business — reflections of what people tell me today. The Annual Report offers a balance of the pragmatics of a typical pitch deck with the broader Vision — the values and meanings — of the company.
Using the archetype of an Annual Report as opposed to the archetype of the miserable PowerPoint ‘deck’ would allow me to merge Vision and business in a way that’s a more illustrative way of imagining outcomes.
What’s the Annual Report from the Future?
The Annual Report from the Future is like a container for representing what your business will look when your Vision is achieved. Rather than pitching forward into the future, you report back from the future as if it has happened. Writing from the future back to the present is a way of codifying my goals with a kind of specificity that a typical pitch from the present into the future might not have.
This approach gives me creative license to tell stories about how I achieved that future, to show that future vividly and with acuity through images and illustrations, specify the plan, and represent the anticipated outcomes as they might appear on everything from the Balance Sheet to news and social media.
Like a typical Annual Reports, this one is undergirded by a few key things: the Vision, the Results and the Financial Performance.
The Vision starts with a statement. In my case, I chose to do so through that ‘From the Desk of the CEO’ that you see in Annual Reports or magazines, like those you find in the seat-back pocket on airlines, back when we used to fly all the time. It’s a statement that precedes everything else and represents the hopes and dreams that form the basis of the ‘Why’ or purpose of the company.
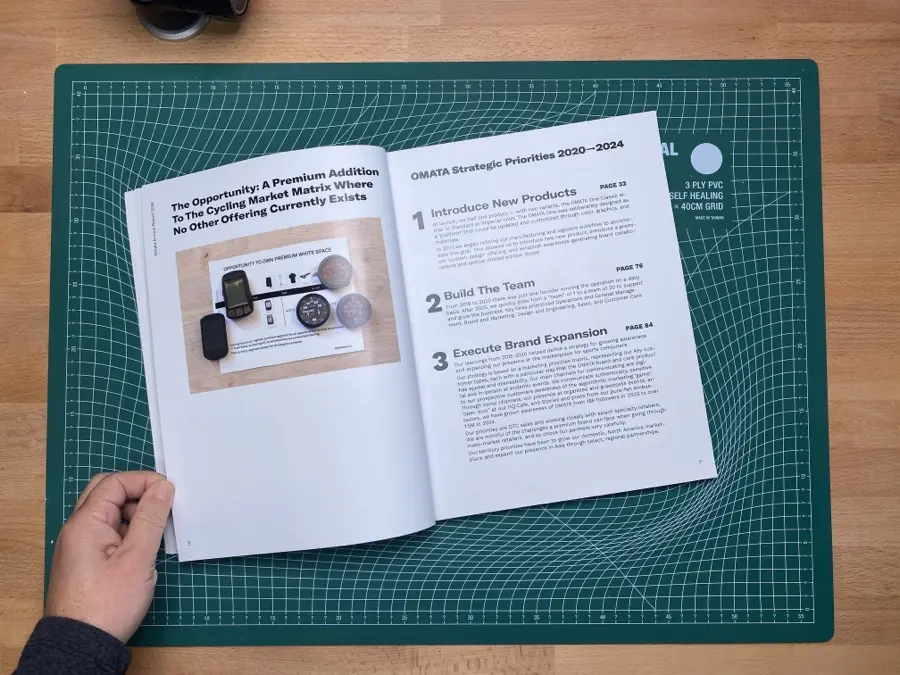
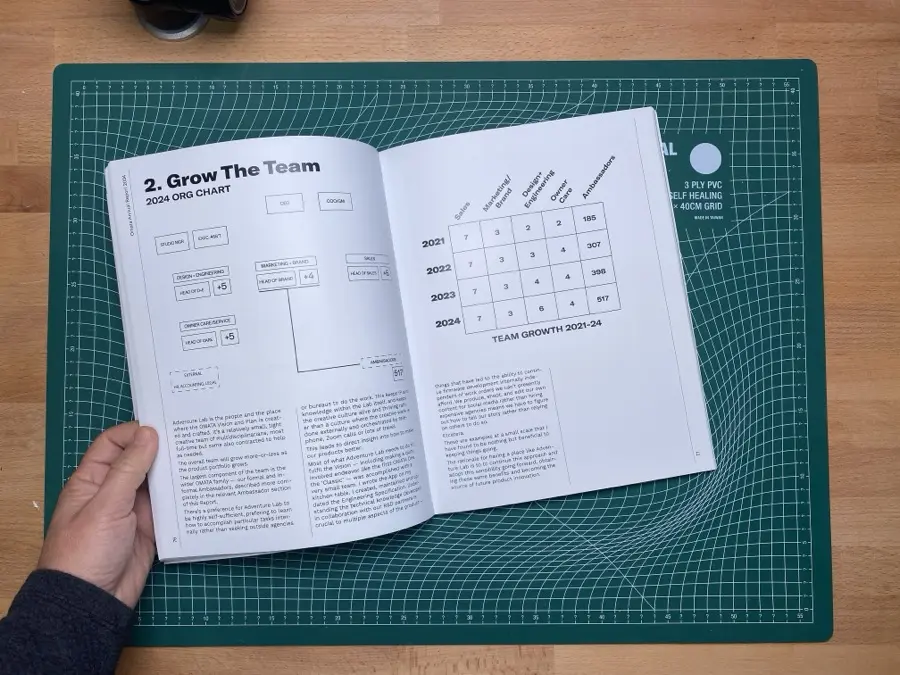
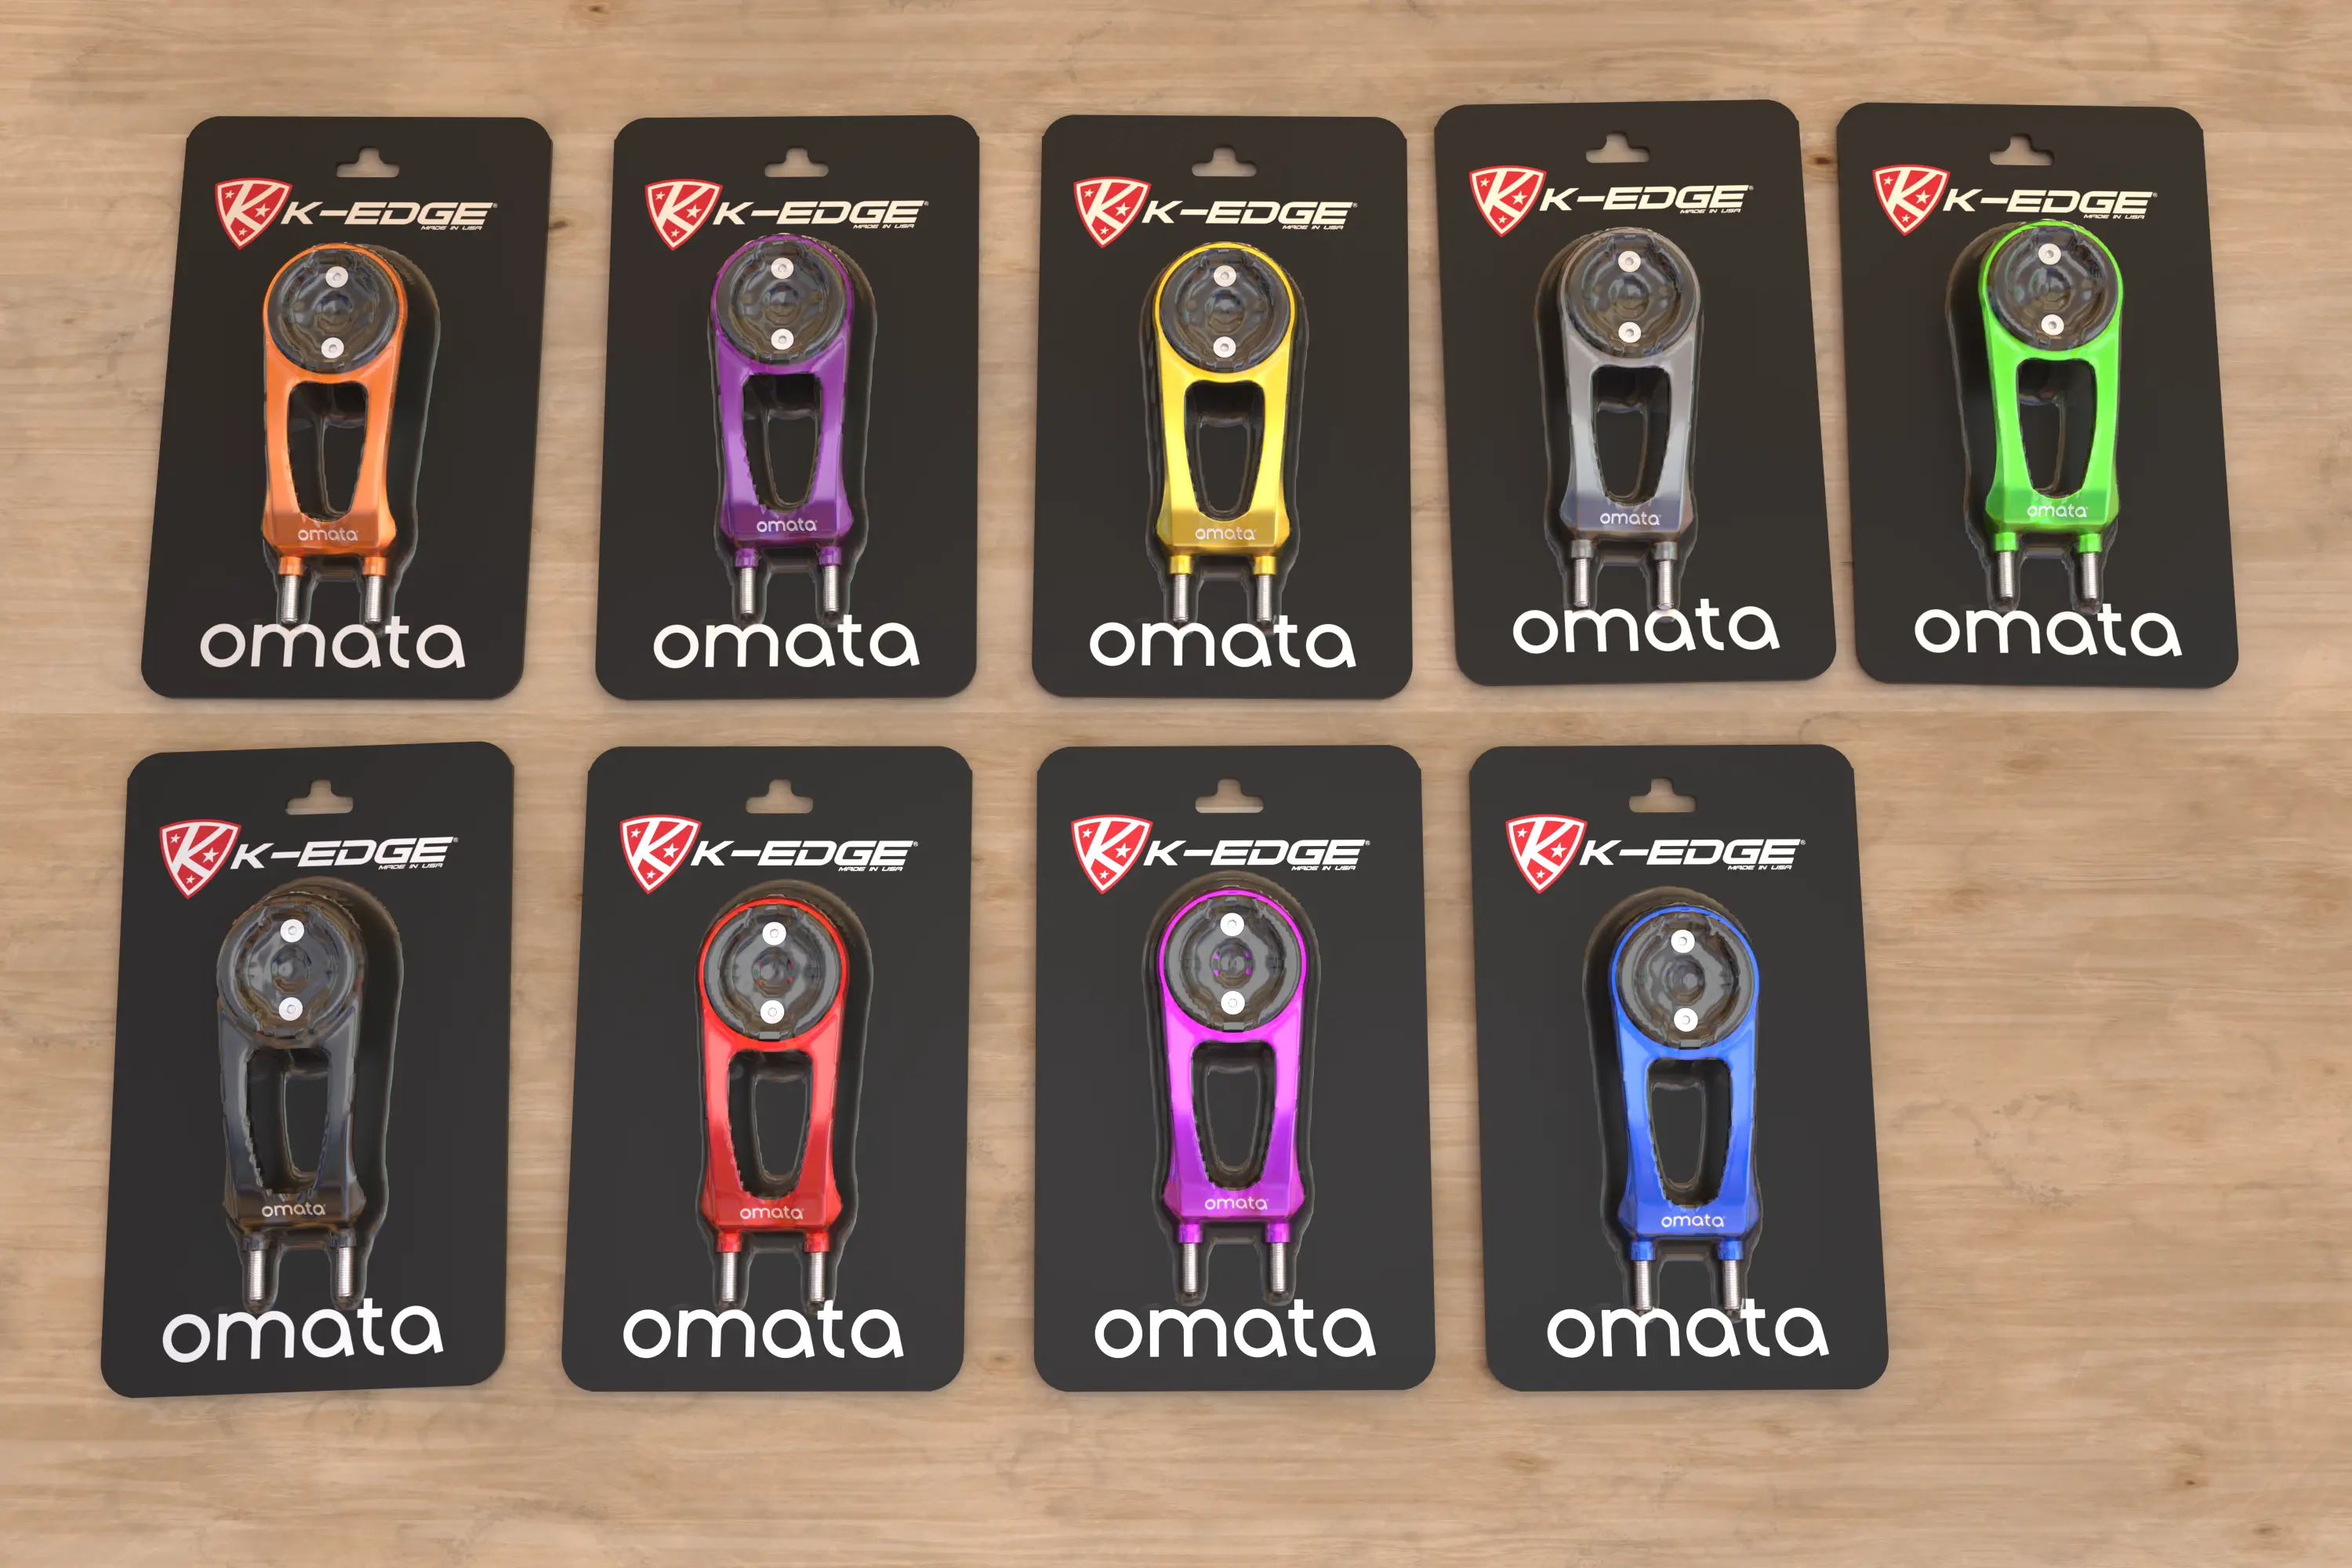
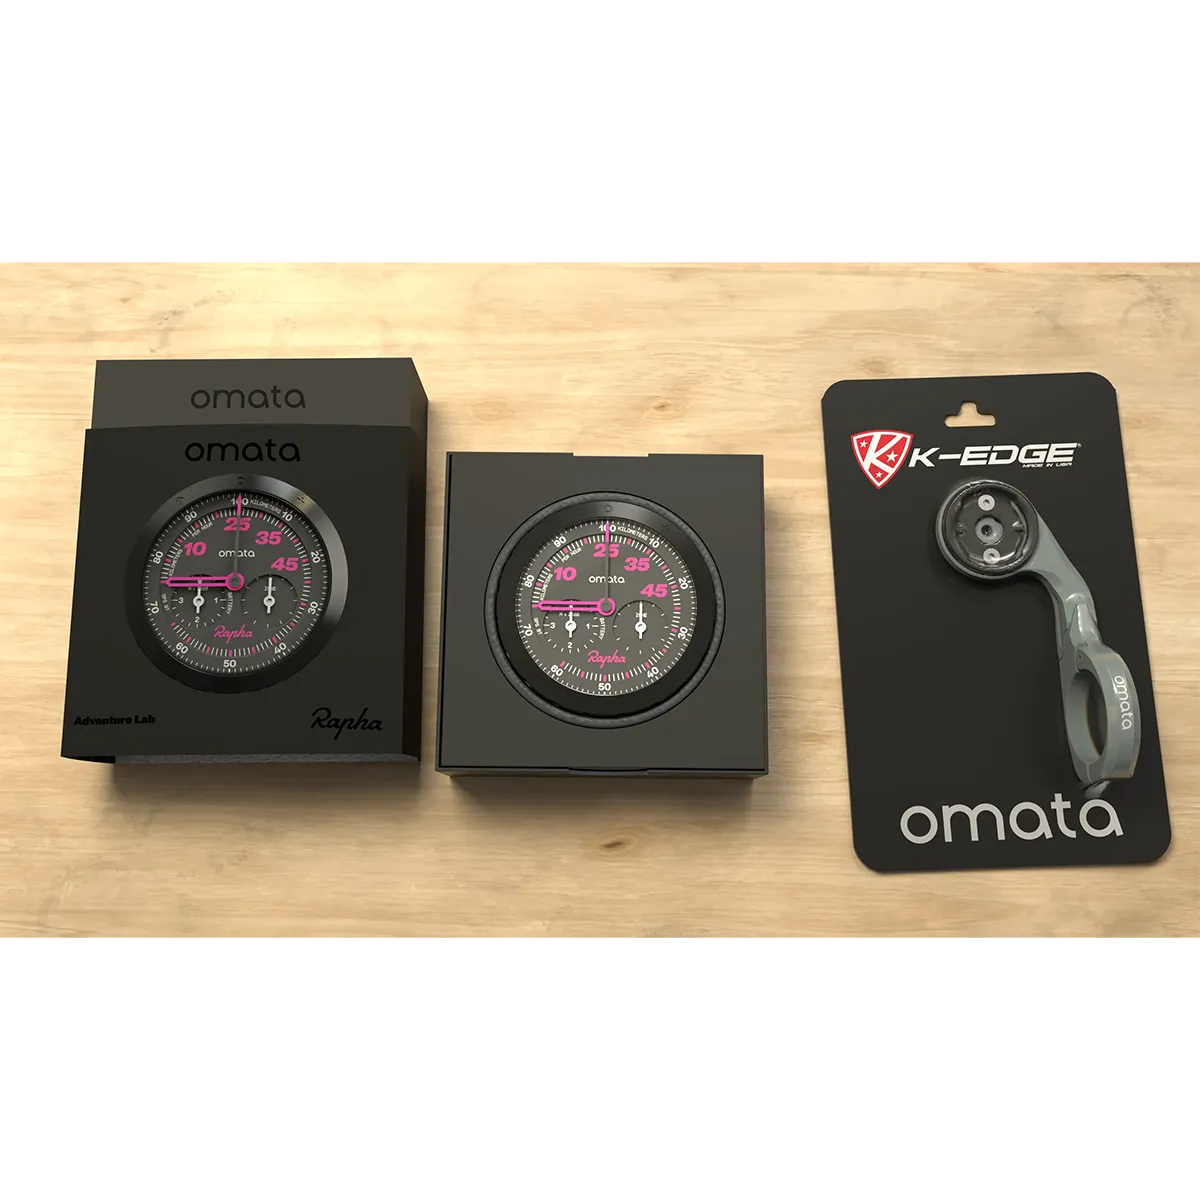
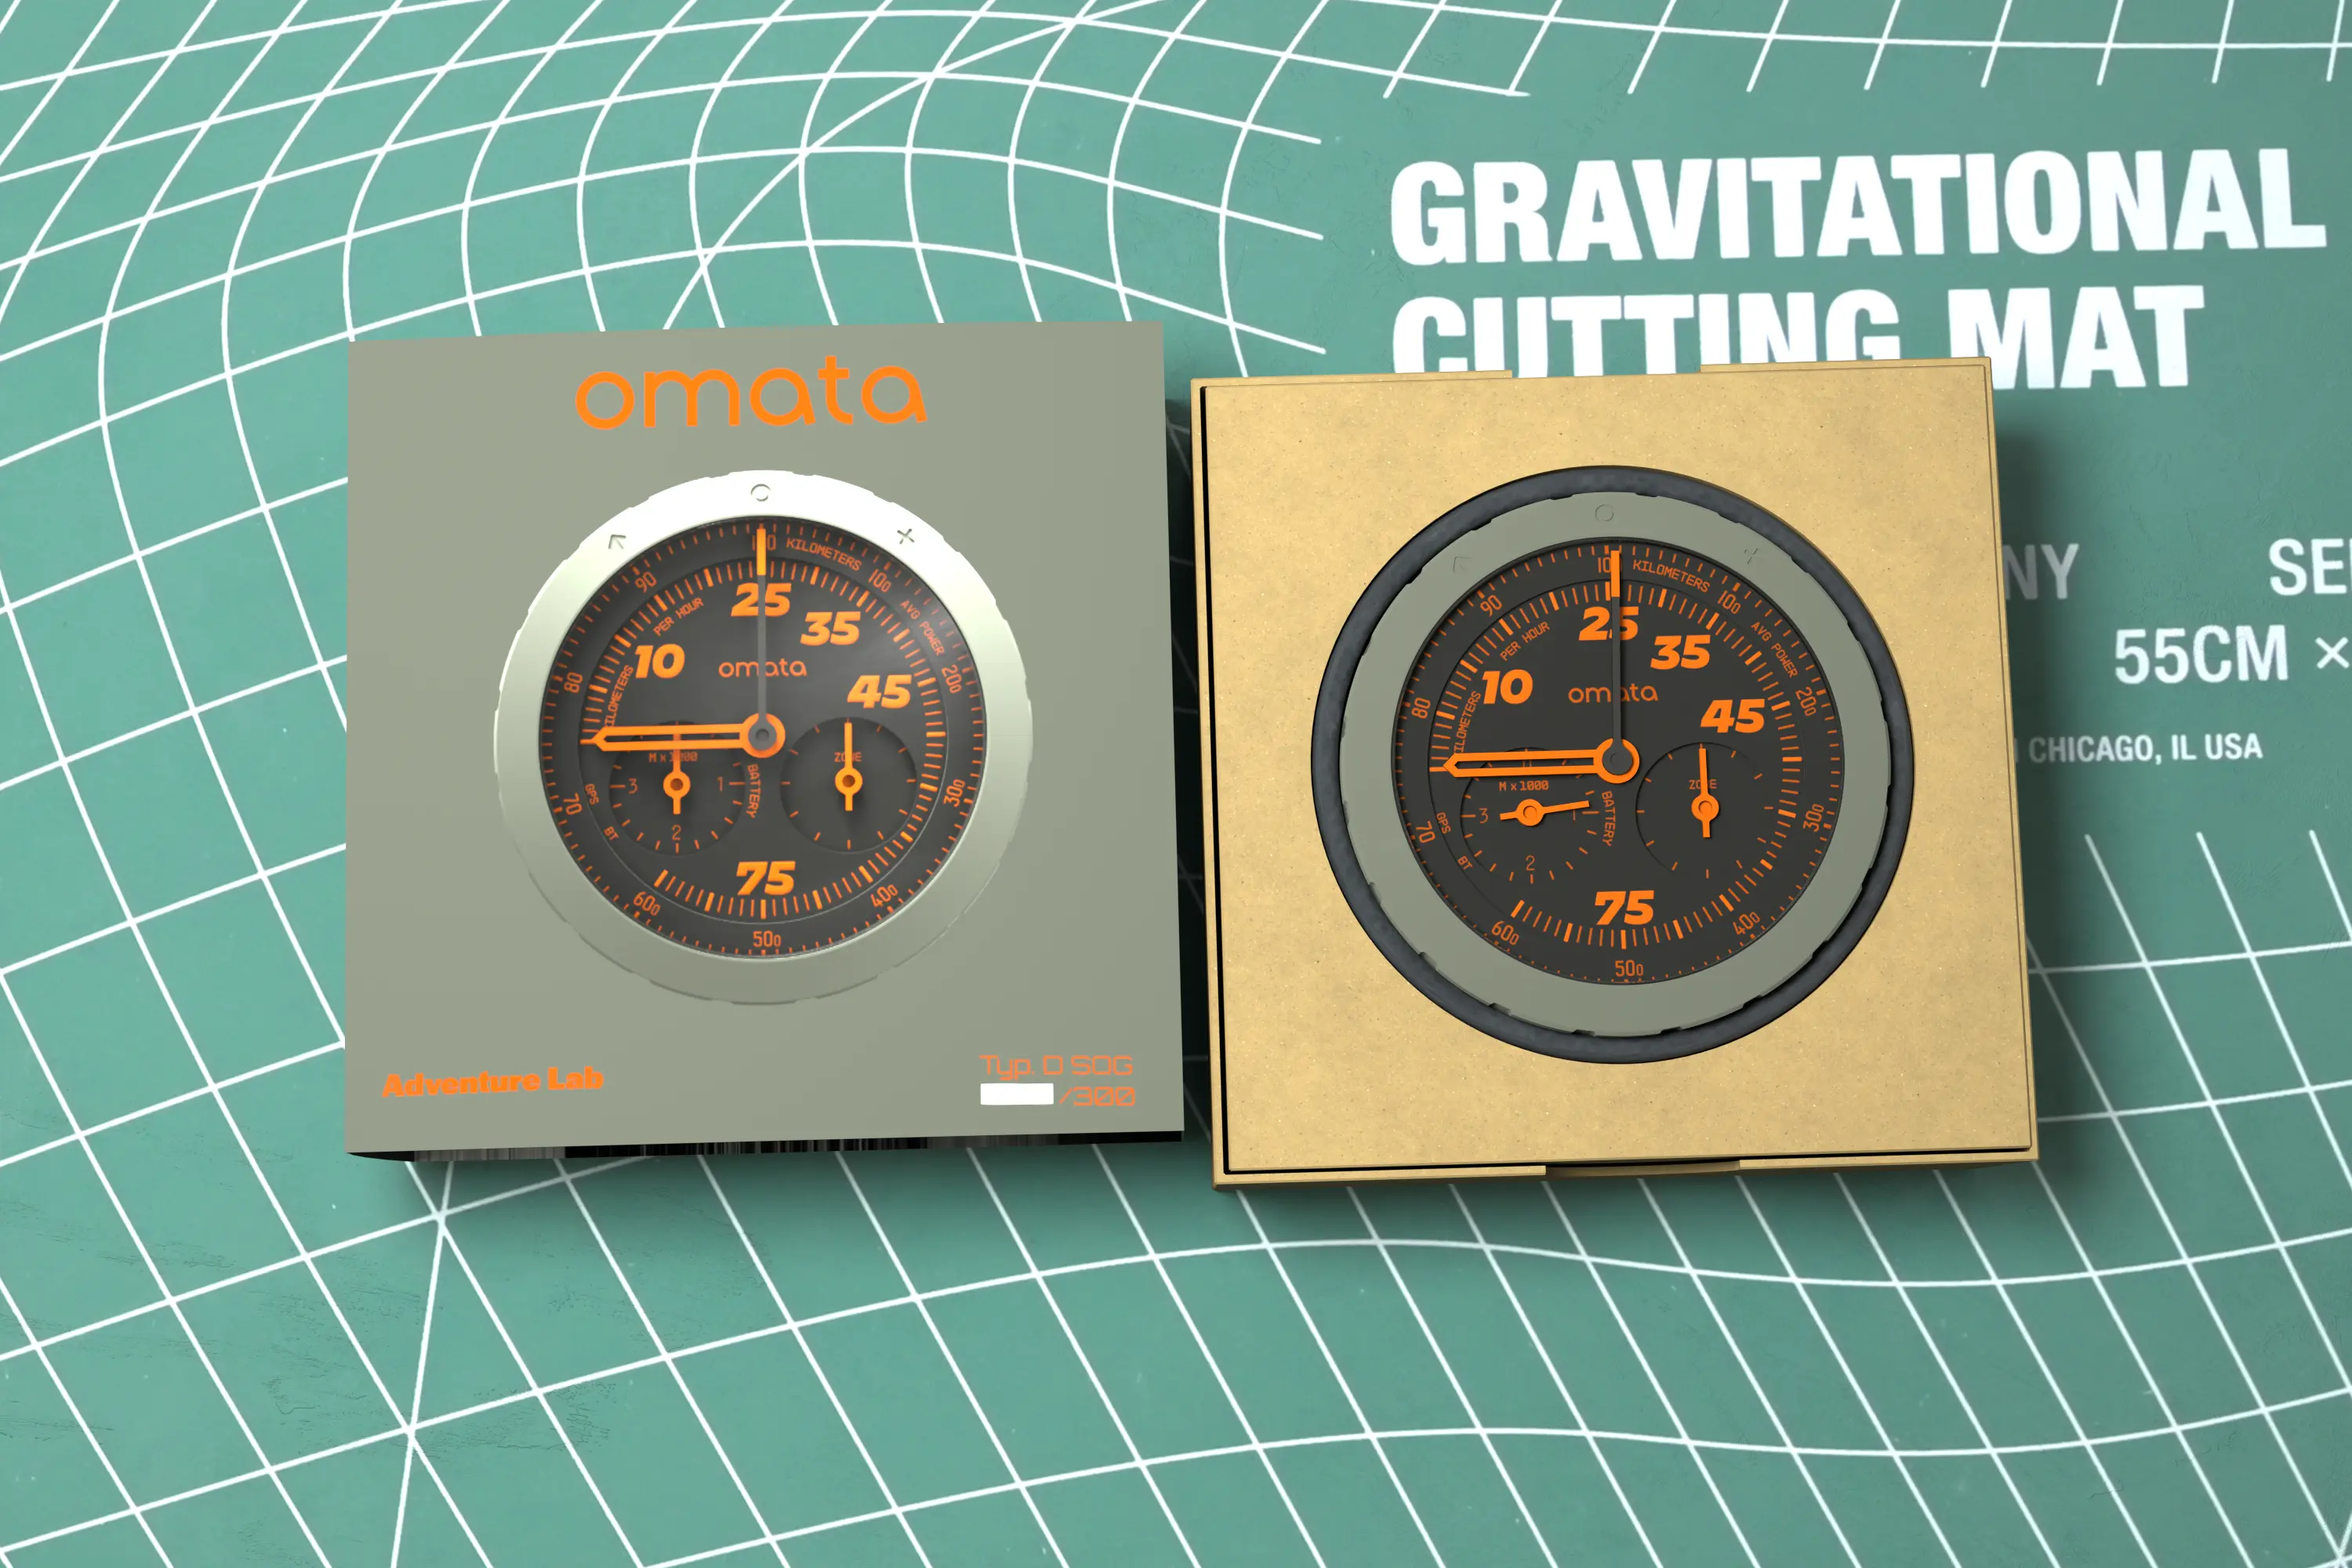
The Results are what have been achieved. I had three categories of results to represent: Team and Workshop — who we are, where and how we do the work; Portfolio — the things, soft and hard, made by the Team in the Workshop, that we sell, and; Plan — how specifically we get from now to 2024.
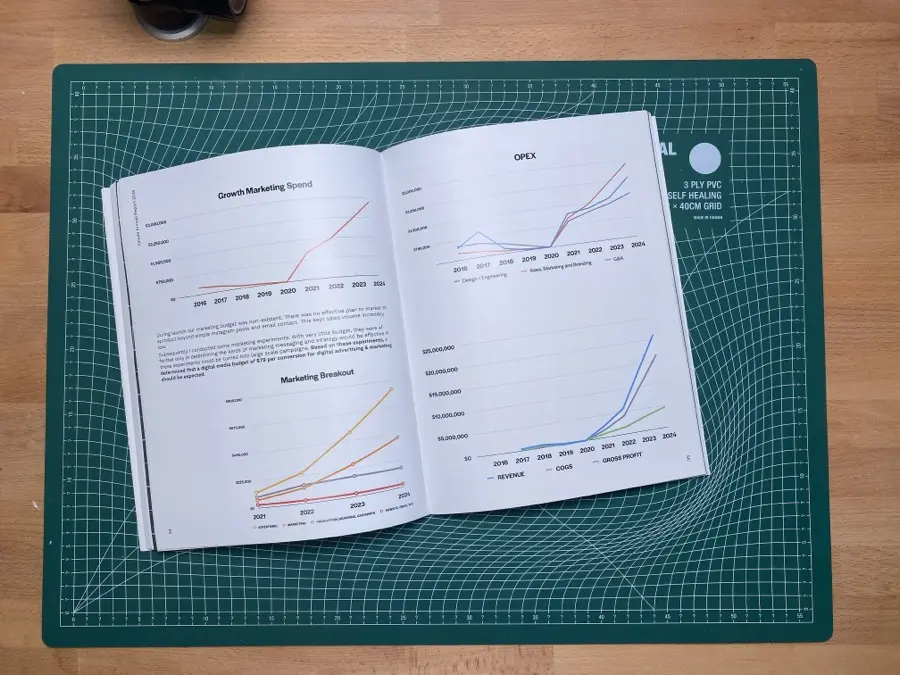
The future Financial Performance outcomes are based on the gigantic Financial Model I commissioned several years ago. It’s what tracks the business, with actuals that represent the past, and projections representing the future. Financial Model projections are like a business simulator running in Excel. I can pull levers to add products, adjust BOM, hire people, lease a gleaming global headquarters. All of the sort of things you’d do to run and grow an enterprise.
In many respects it is the Financial Model that undergirds the Annual Report from the Future.
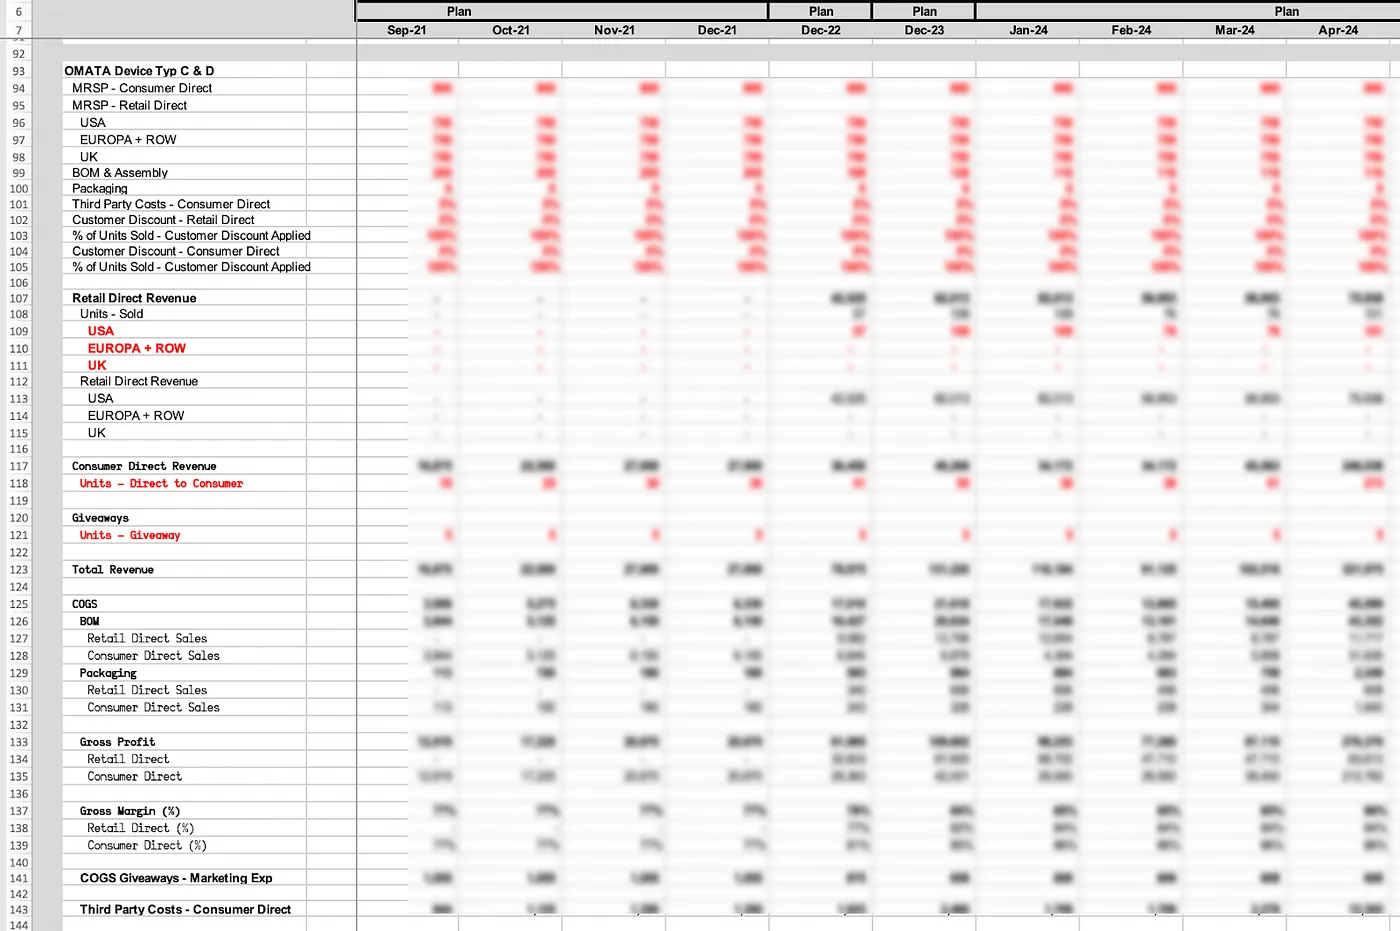
The problem with Financial Models is that they are all boxes and numbers. The Financial Model doesn’t have much to show for itself at all, except for those speculative graphs all going up and to the right.
For example, in my Financial Model is a tab named ‘Product Build-Up’. If you click to show that tab, you’ll find lots of rows and columns and sections for products represented by BOM, Sales Volumes, Third Party Costs, Discounts — lots of detail without much visual acuity.
What do I mean by this?
Say a prospective investor reasonably asks — “Say..this ‘Product Typ C & D I see starting from row 93 to 144’..what is that? What’s it look like? How is it made?” — all you have are boxes with numbers going on for zillions of columns.
What’s the b-side of all that? Can you actually show what you mean more vividly than a grid of calculations?
Conclusion
I’m a kind of ambidextrous maker/thinker/doer guy who routinely bounces back and forth from big idea to code and experience consequence to design execution, from a vision of something to actually opening Xcode or Solidworks to prototype that idea or capture it as an engineering specification. My sweet spot is to imagine and then figure out precisely, with specificity, how that thing I’m imagining can be materialized.
In this respect, the first benefit I found to this approach is that I was forced to add detail to the Vision such that I could report specifically on how I would achieve it and what I expected the outcomes to be. The end result is a highly detailed and specific Plan. That Plan is mutable, but it provides the contours — it’s points a direction. In the Annual Report, I’m doing as much specifying as possible and writing it down to explain how the Vision will be achieved — which machines, what kind of team member, what design, mechanics, firmware and electrical design changes to execute, how much these things cost, how long it will take to achieve. Etcetera.
The second benefit is that the Vision is vivid. It’s immersive and has a high degree of acuity. It’s hard work trying to figure out how to lever out your imagination of a possible future and get it in a form that can be printed out. My imagination doesn’t have many letters, boxes, arrows, and bar graphs floating around. Why should my ‘pitch’?
The most remarkable aspect of going through this process was that there were ideas and new considerations that arose along the way quite unexpectedly and organically while in production on this Report. (I mentioned such a thing in a recent post here.) The work of translating some vague ideas and giving them some extra oomph, sitting with them for a spell and marinating on hypothetical design decisions or financial considerations and then working them — oftentimes with no clear idea where I’d end up. In fact, when I started this whole exercise, I had not much more than a few valuable marketing insights, that gigantic Excel financial model that kept getting updated and refined, about a dozen bullet-pointed pitch decks from the first six years, an ambition to figure out how to continue the business, and a raging pandemic outside.
The biggest benefit to this was it refined my own sense of what it was I wanted to achieve, the purpose and values that would be imbued in the OMATA brand and products, and the kind of team and customers I imagine would be part of that future.
The Annual Report is a Design Fiction archetype for representing the outcomes one hopes for, or desires to achieve. It’s like a letter to yourself from the near future. Every CEO, EVP, SVP, Director — everyone should be asked to do one, taking the archetype of the end-of-year report — or even end-of-quarter report — and writing it back from the future to yourself. It’s great for team alignment and for setting expectations and goals.
This is different from doing the ‘Press Release’ that is an approach I hear attributed to Amazon. That’s clever and interesting — but a Press Release is always unassailably ‘perfect.’ And it never goes into details as to the ‘how’. Press Releases contain what you hope the press will say about your business or product or service when it launches. That’s fine — and the Press Release as a Design Fiction artifact has a role to play. But I find the required completeness and thoroughness of the Annual Report archetype much more compelling. The Annual Report lets you spell out your Vision and the Plan that you expect will achieve your desired outcomes. I’ll do one every year, reaching into the near future to help codify the things we’re imagining and to make sure everyone has a firm grasp of where we are, and where we are going.
A Postscript On Design Fiction
Speaking more generally, you may wonder — what is this approach?
It’s called Design Fiction, a mindset and approach for representing possible near futures by creating artifacts that index these possible futures. This is an approach we pioneered at the Near Future Laboratory and best referenced in the essay from 2009, Design Fiction. TBD Catalog, a product catalog from the future, (as the future looked like from 2014), is an exemplar of Design Fiction, using one of my favorite archetypes — the product catalog. More recently, my colleague Fabien Girardin gave a Design Fiction talk overviewing our general approach to helping organizations think about what’s next.
By creating these artifacts from the near future you’re digging into the details of your vision for that future. It’s as if you went to that future, found a few things that are representative of what’s happened there, and brought them back, like a time-traveling anthropologist, or CEO, or engineer. The artifacts you find in that possible future are what we refer to as ‘archetypes.’ For example, the Annual Report I created is an archetype, or pattern, or container into which you index relevant aspects of the future. Other archetypes are things like Quick Start Guides, Unboxing Videos, City Guides, Product Catalog, Maps (of, for example, a near future city amenable to self-driving cars), an FAQ Page, Repair Manual, News Article, etcetera.
Getting good at working with a variety of archetypes is a sign of proficiency in bridging the gap between imagination and materialization, or now and some near future. Design Fiction
By creating, as one example, a Quick Start Guide for your product vision, you have to figure out how your typical, or generic customer would use your product — perhaps this is the first time they’ve ever used a self-driving car. They’ve seen them in the movies or read about them online, but now they’re behind the Algorithm..err..the ‘Wheel’ — and there are a few things that are different from the old-fashioned car. All the modes and mechanisms, emergency buttons, cockpit layout, security modes — how does all of this work? You can’t just get away with waving your hands and saying, ’that’ll all get figured out..’. You have to do the work, at least at a preliminary level to determine what it is that’ll need to get figured out. (And even if you imagine that your product is so simple to use it doesn’t need a manual, wonder yourself what kinds of questions your customers might ask as they ponder whether they’ll make the investment — and create an FAQ, or an Advertisement that forces you to dig a bit deeper and own the challenge of vividly representing your ideas)
Use the Contact Form below to discuss how you can engage Near Future Laboratory to help you make sense of your organization's possible futures.